
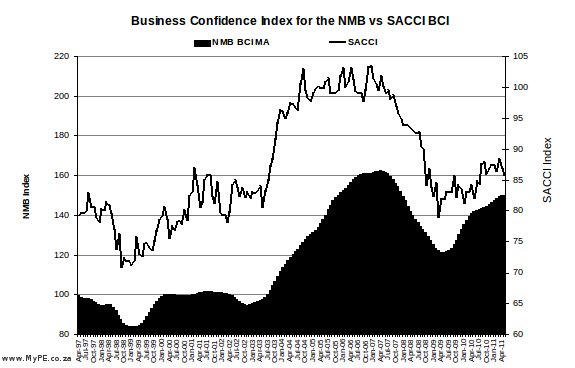
As highlighted in May the most recent monthly trend cycle data for the NMB BCI continues to suggest a consolidation in the rate of growth of economic activity in the Metro. While not as yet indicating a decline in the NMB BCI, the performance of key indicators such as new car sales in the Metro, the local rate of inflation and a decline in consumer confidence are beginning to suppress the performance of the index.
To receive the Nelson Mandela Bay Business Confidence Index (formerly the Porth Elizabeth Business Confidence Index) compiled by Dr Neil Bruton of RGT Smart Ltd, contact the Nelson Mandela Bay Business Chamber.
With GDP growth accelerating in first quarter of 2011 by a higher than expected 4,8 percent and with real annual growth in retail sales registering 9.8 percent in April, the recovery in the South African economy is well on track with current expectations that GDP growth for the year will end up around 3.6 percent, up from 2.8 percent in 2010.
However, there are indications that the pace of growth is slowing in the second quarter of 2011. Manufacturing production for April 2011 increased by only 0,4% when compared with April 2010, and while probably influenced by the number and coincidence of public holidays in April and by shortages from Japan as a result of the Tsunami in March, the lower level of activity was also reflected in the Kagiso PMI which, while still suggesting solid growth momentum in manufacturing, also softened in May. Furthermore, while the BER’s manufacturing survey reflected unchanged business confidence during the second quarter it noted that business conditions had deteriorated during the quarter. Other indicators of possibly slower growth momentum include the SACCI BCI which in May declined to its lowest level since July 2010 and the RMB/BER business confidence index which adjusted back quite sharply by 7 index points, to below the breakeven level of 50, during the second quarter. Furthermore, recently released Reserve Bank data reflects ongoing very slow growth in real fixed capital formation in the economy, and rates of growth in credit extension and money supply remain historically low after two years of economic recovery. House price growth also remains very low to negative depending upon the research institution and household debt levels during the first quarter remained high at 76.8 percent of disposable income only slightly down from the record levels of 82 percent recorded in 2008. It appears therefore that households have done relatively little in nearly two years of sound real income growth to significantly consolidate debt positions.
While the FNB/BER consumer confidence index improved marginally in the second quarter to a firm level of 11, it remained below the level of 15 recorded in both the first and third quarters of 2010.
It appears therefore that while the economy remains firmly on a growth path a slower pace of expansion may be emerging which could put the NMB BCI under further pressure in coming months.
With regard to the details of the NMB BCI, the trend cycles in eight of the sub-indices reflected improvement, six reflected deterioration, and one moved sideways.
The indicators that supported the NMB BCI through May included the trend cycle in the real value of imports which once again reflected growth and the trend cycle in the price of gold which also assisted the index. The underlying trend cycle in the real seasonally adjusted value of manufacturing continues reflecting slow growth as do the trend cycles in real retail sales in the Eastern Cape and in the real value of new building plans passed and in new buildings completed, with both of the latter reflecting very marginal improvement from a very low base. The trend in the number of passengers arriving at the PE airport showed some improvement as did the trend cycle in the JSE all share index through May.
On the downside, the trend cycle in the local rate of inflation weighed on the index, the trend in the rand US dollar exchange rate weakened marginally, and the trend cycle of new car sales in the Metro continued weakening, raising questions regarding the underlying strength of the local economy. The trend cycle in the real value of exports also moved into decline through May and the trend in total new vehicle sales in the country has also begun weakening. Of concern is the deterioration in the level of consumer confidence in the Eastern Cape which dropped from 14 in the first quarter to 13 in second as measured by the BER, primarily as the result of a big drop in how respondents in the Eastern Cape expect the general economic position in SA to develop over the next 12 months, the rating of which fell from 21 in the first quarter of 2011 to 11 in second.
The trend cycle in the prime interest rate moved sideways through May having no meaningful effect on the overall index.
The Nelson Mandela Bay Business Confidence Indicator, NMB BCI, has been specifically developed to offer a service to investors, potential investors and businesses wishing to understand developments in economic circumstances in the region or to analyze the environment impacting upon existing undertakings or upon the establishment of new undertakings.
The NMB BCI was modelled upon the original SACCI BCI, (which was substantially restructured during February 2001), and as such is not a ‘confidence indicator’ in the sense of asking business people how confident they feel about current or future circumstances, it is rather a composite of economic indicators that are accepted as reflecting the environment that businesses are actually experiencing and thus have the greatest bearing on the business mood. As SACCI says;
“The BCI is a market-related index that reflects not what business decision-makers are saying, but what they are doing and experiencing. It is likely that in any one month, the business mood will be influenced both positively and negatively by developments in various sectors of the economy, and the BCI seeks to reflect the net result of these influences.”
The NMB BCI is a composite index tracking the performance of fifteen key economic indicators chosen from those available that are believed to best reflect the business mood in the PE / Uitenhage area.
The following indicators have been chosen for inclusion in the NMB BCI:
- The rate of inflation, as measured by the Consumer Price Index for the PE / Uitenhage region;
- The prime rate at month end;
- The Rand/ US$ exchange rate;
- Retail sales in the Eastern Cape;
- The average monthly gold price in dollar terms;
- Merchandise imports in real terms;
- Merchandise exports in real terms;
- The total number of new passenger cars sold in the PE / Uitenhage region;
- The value of building plans passed in the PE / Uitenhage region in constant prices;
- The value of buildings completed in the PE / Uitenhage region in constant price terms;
- The performance of the Johannesburg Stock Exchange, as indicated by the JSE All Share index.
- The RMB BER Consumer Confidence Index for the PE / Uitenhage region from the Bureau for Economic Research of Stellenbosch University.
- The total new vehicle market in South Africa
- Number of passengers arriving at the PE airport
- Real value of seasonally adjusted manufacturing sales in South Africa
These indicators are all in constant price terms where applicable and are seasonally adjusted and trended using the X12 seasonal adjustment programme. The trend cycles are aligned, synchronized and weighted to reflect the relative impact of each of the indicators on business activity in the region.
NMB PEBCI consists of both key regional statistics as well as national statistics that have a countrywide bearing on the business mood and as such have to be incorporated in a composite cycle that seeks to reflect the local business mood within a national context.
Dr Neal Bruton of RGT Smart Ltd., has compiled the NMB BCI on behalf of NMBBC.


Alan Straton
Latest posts by Alan Straton (see all)
- SAFRA Marks 15 Years and Nearly 500,000 Moving Quotes - 19 October 2026
- SAFRA Unveils Exciting Website Upgrade for Easier Moving Quotes - 19 October 2026
- SAFRA Launches Powerful New Furniture Volume Calculator - 19 October 2026
- What Parents Need to Know about Polio - 19 October 2026
- Rodent Checks Should Include the Parked Car, Says Gqeberha Pest Control Operator - 19 October 2026
