
On Thursday 25 March 2010 the Nelson Mandela Bay Municipality’s Council declared Nelson Mandela Bay a local drought disaster area in terms of the Disaster Management Act (Act 57 of 2002).
In the period prior to this declaration from January 2009 to March 2010, the average daily water consumption was 270.60 megalitres.
In the period of water restrictions stretching from April 2010 to July 2011, the average daily water consumption was 241.13 megalitres.
Using some KNOWN numbers provided by the Municipality as well as some considered assumptions we have produced a spreadsheet that MAY go some way to explaining the tardiness (nay, more like downright reluctance!) of the Municipality to lift the water restrictions.
The known numbers are:
- The daily average consumption in megalitres from April 2010 up to July 2011.
- The tariffs charged during the water restrictions.
- The date water restrictions started.
- We used only 30 days per month in our calculations.
The unknown ASSUMED numbers are:
- The percentage split between Domestic, Commercial and Industrial consumers
- The percentage split between the 3 tariffs and penalty tariffs
We believe that we have erred on the side of conservatism but would welcome your input and checking of our somewhat shaky maths skills. REMEMBER the known numbers are consumption and tariffs – the unknown percentage splits may exert a huge influence on the final figures.
By the way – we have asked a number of people (including our so called Communications department) if they know what these splits are and no-one seems to be able to tell us just what the split is, or how much was invoiced to ratepayers in penalties.
We based our workings on the following ASSUMPTIONS:
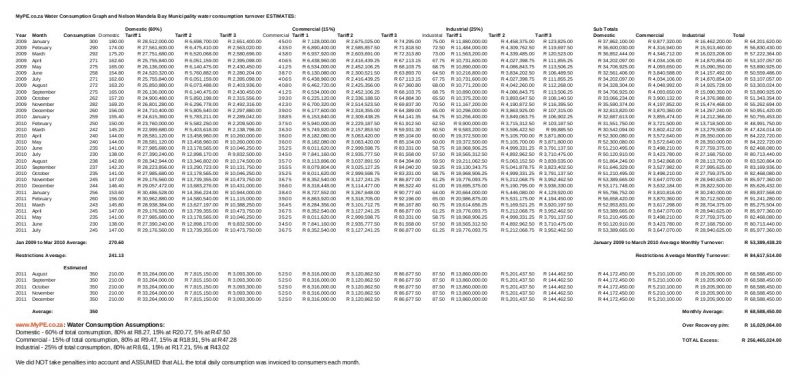
- Domestic water consumption as 60% of the total consumption, with 80% at R8.27, 15% at R20.77 and 5% at R47.50 per kilolitre.
- Commercial water consumption as 15% of the total consumption, with 80% at R9.47, 15% at R18.91, 5% at R47.28 per kilolitre.
- Industrial water consumption as 25% of the total consumption, with 80% at R8.61, 15% at R17.21, 5% at R43.02 per kilolitre.
- We did NOT take penalties into account and ASSUMED that ALL the total daily consumption was invoiced to consumers each month (i.e. no loss/shrinkage/leakage to the Municipality).
- We projected that the daily water consumption from August to December will be 350 megalitres (80 megalitres MORE per day than before the water restrictions).
The average daily consumption figure during the time of the water restrictions (April 2010 to July 2011) was 241.13 megalitres.
Using the above figures we ESTIMATE that the turnover from water sales was an average of R 84,617,514.00 per month during the water restrictions.
Using our increased estimate of 350 megalitres of water consumption per day and the NORMAL tariffs charged for the remaining months of this year we estimate the the turnover from water sales will be an average of R 68,588,450.00 per month.
As we said before; “Let us give you R 16,029,064.00 reasons why the water restrictions have not been completely lifted”
Our Concerns:
- The numbers (to our rands and cents eyes) look quite high but on a percentage basis the ‘normal’ (Part A) tariffs are far below the ‘restriction’ (Part C) tariffs which would still indicate that the Municipality made money out of consumers during the drought, whatever the REAL figures are.
- Is it really possible that the monthly water sales turnover nearly DOUBLED from March 2010 to April 2010 and on?
If our estimates are correct, then the Municipality added an additional R 256,465,024.00 in turnover over the 16 months of water restrictions.
Should you notice any glaring anomalies please note them in the comments section below. Should you want to see the spreadsheet contact us with the e-mail address you would like us to send it to.
Click on the image below to see the Spreadsheet Image.


Alan Straton
Latest posts by Alan Straton (see all)
- South African Conquers Rats on the World Stage - 30 October 2026
- Old JPG on a Memory Stick? Vectorization Studio in Observatory Redraws Faded and Low-Resolution Logos by Hand - 30 October 2026
- ReAutomated Adds Robot Palletising and Case Packing Cells to Existing South African Packing Lines Without Stripping Out the Conveyors - 30 October 2026
- From a 5 KM Sprint to an Ultra: Punisher Sets Out Its Magaliesberg Obstacle Race Formats for First Timers, Teams and Fitness Clubs - 30 October 2026
- Rotary or Dual Action? Germiston’s Polisher Lists Its Machines, Buffs and Compounds for Car Paint and Metal Finishing - 30 October 2026

I don’t mind that penalties were charged during water restrictions, but what I do have a concern about is what exactly have they done with the money? Have they wasted it, as our municipality has become quite famous for? Have they put the money aside to build another dam? Have they put the money aside to install pipes to allow water to be distributed from a 100% full dam to an empty dam? What have they done with the money?
The figures are frightening, considering the amount of poverty in our area.
No doubt that burning question on most people’s mind’s will be what was done with that money. The questions Twisted Sista posed are spot on in my opinion. I guess the one I would ask now is, Will the municipality tell us whats been done?.. doubtful, but I can always hop 🙂
“I do believe you have thumped the proverbial nail on its proverbial head!” was an e-mailed comment that I received today with regards to the above.
Just got back from a Council meeting and it appears that my estimate of R16 million additional turnover a month during the water restrictions was not far off.
In an answer to a question posed by Councillor Dean Biddulph the Acting Municipal Manager, Elias Ntoba, confirmed that prior to water restrictions the Council was invoicing R28 Million a month and that DURING water restrictions the invoicing per month rose to R41 Million – an increase of R13 Million.
Ntoba also confirmed that the Domestic consumption is an average of 66%.
Of course the other questions that now need to be raised concern things like a comparison between the consumption vs the actual charges and the split between ATTP Programmes and leakage/wastage.